The output of a RAT is usually a numeric score, which may then translate into a risk level and a recommendation to a judge or magistrate, often through a decision-making framework.
Numeric Scores
The RAT algorithm adds up all the points assigned to a person based on its input variables, weighs them, and produces a total score. These numeric scores are meant to represent the likelihood that someone will fail to appear in court and/or be re-arrested.
Each tool has its own score range, depending on how many questions it asks and how many points it assigns. The VPRAI, for instance, ranges from 0 to 9 points, while the Colorado tool, CPAT, ranges from 0-82 points.
Combined vs Separate Scores
RAT results appear either as one composite score, combining failure to appear and re-arrest, or as separate scores for each outcome.
Some tools, such as the Virginia Pretrial Risk Assessment Instrument (VPRAI) and Virginia Pretrial Risk Assessment Instrument-Revised (VPRAI-R), only produce one overall risk score that represents both types of predicted risk. Some tools only predict for a single risk category; Washington’s Adult Static Risk Assessment1Carl McCurley: Development, Testing, and Use of…The Adult Static Risk Assessment, Washington State Center for Court Research only predicts recidivism, while, according to our interview, the RAT in Johnson County, Kansas, only predicts failure to appear.2Interview with Media Mobilizing Project, 7/9/2019. See Interview Summary for more information
Other tools produce separate scores for different outcomes. The PSA produces one score for failure to appear and another score for new criminal activity, as well as a flag for new violent criminal activity.
It is important to note that composite risk scores are presenting two different risks within one score. As Sandy Mason stated, “the two risks are different in kind, are best predicted by different variables, and are most effectively managed in different ways.”3Sandra G Mayson: Dangerous Defendants, Yale Law Journal But they are still communicated in one score that buries the very different things they are trying to communicate.
The likelihood that an individual will either fail to appear at court or be arrested for a new accusation are entirely separate outcomes, impacted by a number of different factors in their life. Someone might not be able to appear in court due to lack of days off work, lack of childcare, or lack of transportation. A new arrest could result from over-policing or a slight misstep in their supervision conditions.
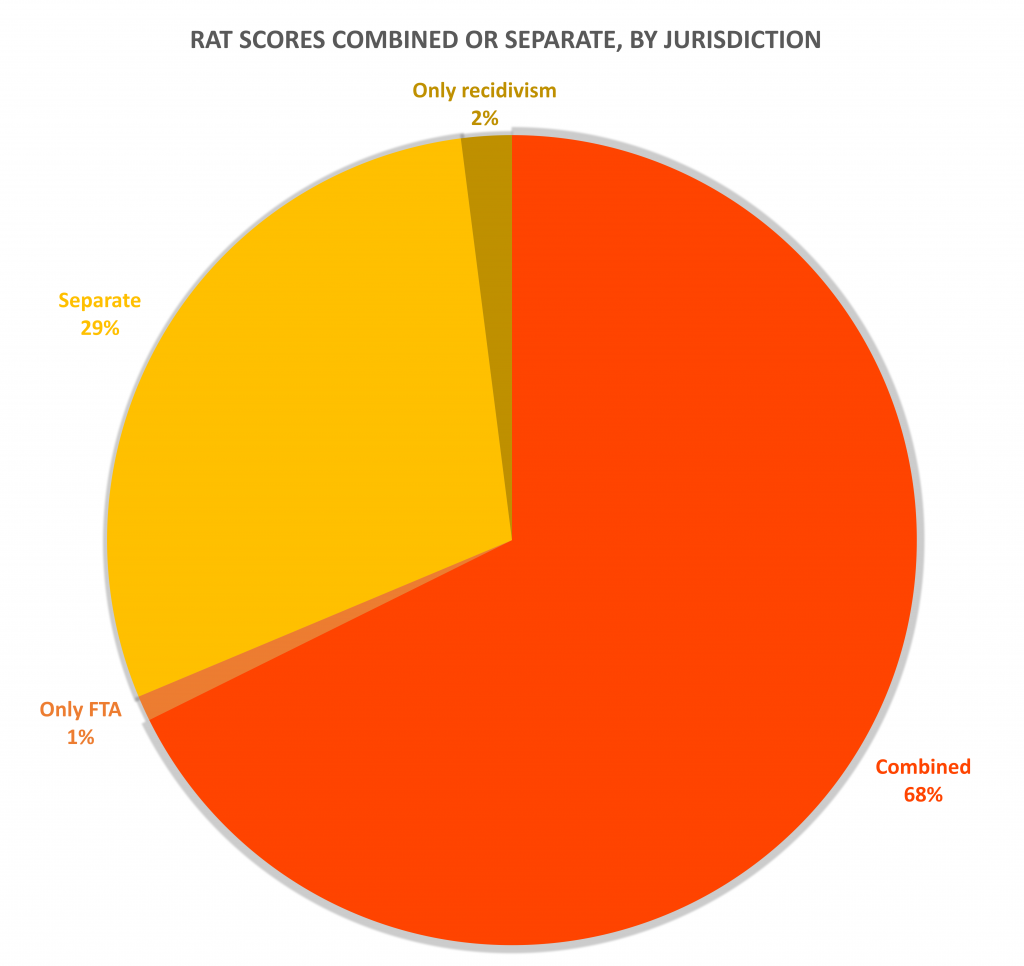
At the time this graph was created, our research had found 267 jurisdictions using a RAT where the score breakdown of combined or separate scores is known. The pie graph below shows this count by number of jurisdictions using a tool that produces a combined risk score (predicting failure to appear and re-arrest in one score) or separate risk scores, as well as those that only predict one outcome.

Total jurisdictions = 267
Risk Levels
No matter the point range, the scores are typically broken down into categories of low to high risk. Tools may have a simple three-level scale of low, medium, and high risk levels, or they may break scores down into more risk level designations.
Many RAT designates which scores translate into which risk category.
For example, the Nevada Pretrial Risk Assessment,4Nevada Pretrial Risk Assessment Administrative Office of the Courts, piloted in Clarke County and several other Nevada counties and now used across the state, has a score range of 0-20 points. An accused person can receive up to two points for each of the 10 questions. The scores are broken down into three risk levels: 0-4 points is low risk, 5-10 points is moderate risk, and over 11 points is higher risk.
The risk level of high, medium, or low, rather than the raw numeric score, is often what a judge, magistrate, or other official making pretrial decisions will see. In many places, as described below, these risk levels are connected to specific pretrial recommendations, often through a decision-making framework (DMF).
For example, a low risk designation might mean someone is automatically released on their own recognizance, while a high risk score may mean someone is detained, released with intensive supervision, or must have a hearing in front of a judge.
Decision Making Frameworks
Some RATs are used in conjunction with a decision-making framework that combines score and charge, with other policy compromises and exceptions, to recommend a specific pretrial outcome for an accused person who receives a particular score or scores on a risk assessment tool.
This framework is a set of policy recommendations that courts, legislators, and other decision-makers have created to decide what kinds of incarceration and community supervision will be recommended after a risk level or levels are assigned by the RAT.
These decision-making frameworks are extremely important in determining whether or not an accused person goes home, gets supervision, or gets locked up pretrial. They “embody crucial moral judgements”5John L. Koepke and David G. Robinson: Danger Ahead: Risk Assessment and the Future of Bail Reform, Washington Law Review in linking particular risk levels to particular pretrial outcomes, encouraging judges and magistrates to assign bail, detention, or supervision according to the framework’s matrix.
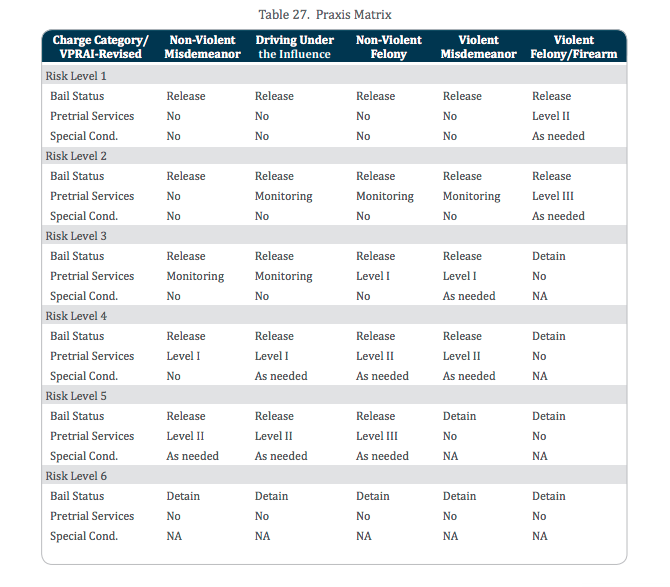
The VPRAI-R matrix, seen below, shows the risk level on the left and the charge type along the top, with recommendations for bail status, pretrial services, and any special conditions for each combination of risk level and charge type listed in the table.

Image generated by Mona J.E. Danner, Marie VanNostrand, and Lisa M. Spruance, Luminosity, Inc.6Mona J.E. Danner, Marie VanNostrand, and Lisa M. Spruance: Race and Gender Neutral Pretrial Risk Assessment, Release Recommendations, and Supervision: VPRAI and Praxis Revised, Luminosity Inc
The Public Safety Assessment (PSA) produces two scores, one for Failure to Appear (FTA) and one for New Criminal Activity (NCA). The PSA is applied differently in different places, but multiple locations use a decision-making framework.
Two examples below use the FTA score on one axis and the NCA score on the other to combine into a pretrial recommendation. The actual recommendations and what each supervision level involves is decided by the locality using the PSA.
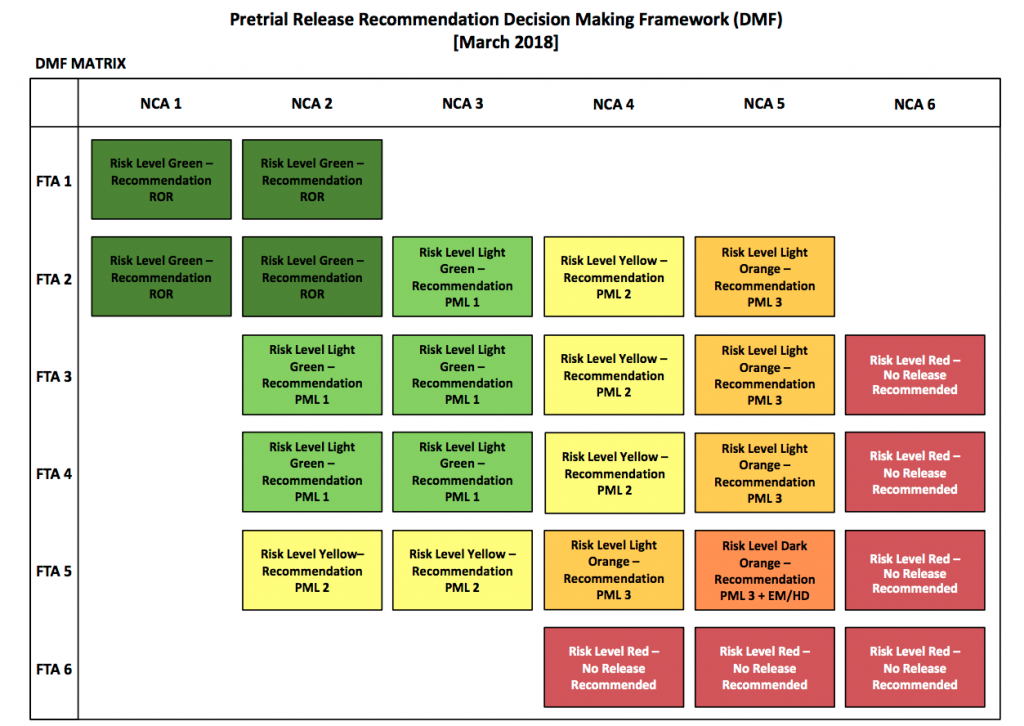
The State of New Jersey passed a law expanding quick pretrial release to thousands of people, and negotiated a decision-making framework7New Jersey Pretrial Release Recommendation Decision Making Framework, March 2018 for folks with higher risk levels, or higher charges.
New Jersey’s table, seen below, is the end result of this longer framework, which specifies the entire process after scoring the PSA, and combines charge with FTA and NCA scores. This DMF is from March 2018 and may have changed.

Image generated by New Jersey Courts8New Jersey Courts, Pretrial Release Recommendation Decision Making Framework

Image generated by New Jersey Courts9New Jersey Courts, Pretrial Release Recommendation Decision Making Framework
But in other communities using the Arnold Ventures’ Public Safety Assessment, you might find that instead of a traditional decision-making framework and matrix, the jurisdiction uses a “decision framework”10Arnold Ventures: Public Safety Assessment: Guide to the Pretrial Decision Framework. Note: accessing some documents may require setting up an account at Arnold Venture’s PSA Pretrial site and a “release matrix”11Arnold Ventures: Public Safety Assessment: Guide to the Release Conditions Matrix“. Note: accessing this document may require setting up an account at Arnold Venture’s PSA Pretrial site.
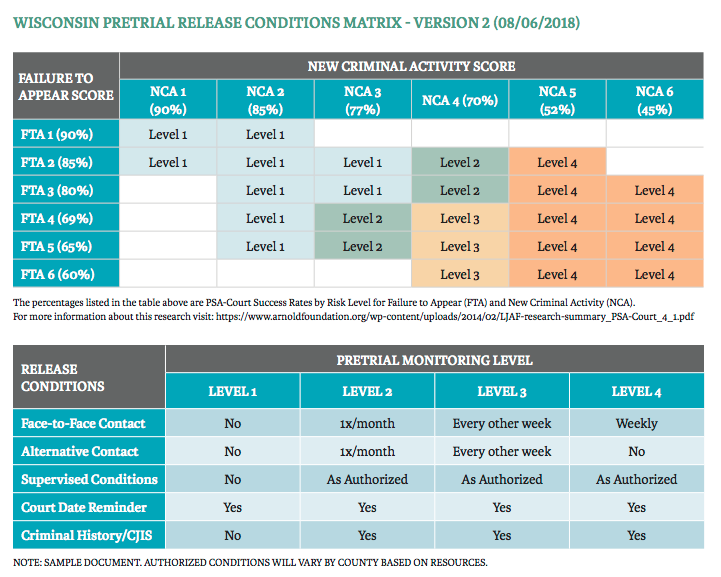
Cities in Wisconsin that use the PSA, such as Milwaukee, may utilize Wisconsin’s Pretrial Release Conditions Matrix. Like New Jersey’s framework, it combines FTA and NCA scores to produce a recommended pretrial outcome. Unlike the New Jersey framework, it only produces four levels of pretrial outcomes, rather than six. This DMF is also from 2018 and may have changed.

Image generated by National Association of Criminal Defense Lawyers12National Association of Criminal Defense Lawyers, Wisconsin Bail Manual
You can read more about negotiated decision-making frameworks and release matrices in Section 2, page 25 and Appendix #3 of Community Justice Exchange’s organizing guide, “Confronting Pretrial Risk Assessment Tools in Decarceration Campaigns”.

